


How to Track Your SalesConversion Rate

5 hours ago
12 min read
Quick answer: To track your sales conversion rate, define the exact starting stage and desired conversion, then divide the number that completed the conversion by the number that entered the starting stage and multiply by 100. For a service business, do not stop at one lead-to-client percentage.
Track lead-to-qualified, qualified-to-booked, booked-to-held, held-to-recommended, recommended-to-client, and overall lead-to-client conversion. Keep the counts beside the percentages, segment by source and offer, and use cohort reporting when the sales cycle crosses reporting periods. The purpose is not to chase one universal benchmark. It is to see where qualified momentum breaks and make one informed correction.
A business owner tells me, “My close rate is 50 percent.” My next question is simple: 50 percent of what?
Five clients from ten held discovery calls is one story. Five clients from ten raw leads is a completely different story. Five clients from ten proposals sent six months ago is different again.
Same percentage. Different denominator. Different diagnosis.
This is why I say, “Know your numbers. You cannot scale what you do not track.” The point is not to build a prettier dashboard. The point is to stop making sales decisions from memory, emotion, or the last conversation that annoyed you.
A useful conversion rate tells you what moved, what it moved from, and over what period. Once those definitions are clean, you can see whether the business needs more leads, stronger qualification, a better booking path, clearer diagnosis, a stronger recommendation, better follow-up, or a different offer.

The Denominator Rule: every conversion rate needs a numerator, denominator, and time or cohort definition.
Sales Conversion Rate Is Not One Number
Salesforce defines sales conversion rate as the percentage of leads or prospects who complete a desired sales action, and its basic lead-to-sale formula is sales divided by leads multiplied by 100. HubSpot uses the same underlying logic and notes that conversion can also be calculated between individual pipeline stages.
That formula is correct. The danger begins when a business uses the phrase “conversion rate” without naming the conversion.
The Denominator Rule Before you report a percentage, write the conversion as a sentence: “Of the people who reached [starting stage], what percentage reached [ending stage] within [time window or cohort]?” If you cannot finish that sentence, the metric is not defined well enough to manage. |
For example:
Lead-to-client conversion: Of all new leads created, what percentage became paying clients?
Discovery-call close rate: Of all held qualified discovery calls, what percentage became clients?
Recommendation win rate: Of all prospects who received a recommendation or proposal, what percentage enrolled?
Follow-up recovery rate: Of all qualified prospects who did not decide on the call, what percentage later converted during follow-up?
Those percentages should not be used interchangeably. They answer different questions.
Track the Conversion Rate Stack
For a founder-led service business, I recommend tracking a small stack of conversion rates rather than one headline close rate. The stages should match your actual sales process, but the logic below gives you a clean starting point.

The Service-Business Conversion Rate Stack.

One of the most useful stages in this stack is recommendation rate. Not every person who attends a discovery call should receive your offer. If the prospect is not a fit, the responsible sales decision may be not to recommend the service. Tracking held-to-recommended separately prevents you from blaming the close when qualification or diagnosis is the real issue.
Related reading: How to Qualify a Sales Lead Before a Discovery Call
Define the Stages Before You Calculate Anything
The math is easy. The definitions are where most small-business reporting breaks.
If one month “qualified” means someone completed the booking form and the next month it means the owner personally reviewed the lead, the rates are not comparable. If one person marks a deal won when the contract is signed and another waits until the first payment clears, the close date is inconsistent.
Write the rules before you build the spreadsheet or CRM dashboard.
Lead: a new person or organization that has provided identifiable contact information or entered your sales process.
Qualified prospect: a lead that meets the minimum problem, readiness, decision, investment, and delivery-fit criteria your business has defined.
Booked call: a qualified prospect with a scheduled sales conversation.
Held call: the scheduled conversation actually occurred. Reschedules should not be counted as held until the conversation happens.
Recommendation: you formally presented the offer, scope, investment, or next paid step because you determined there was a reasonable fit.
Won: the client completed the action your business defines as a sale, such as signing the agreement and paying the required invoice or deposit.
Lost: the opportunity is no longer active and has a documented reason. Do not leave dead opportunities sitting in “follow-up” forever.
Definition discipline Your CRM cannot fix vague definitions. Use the simplest system your team will update correctly, but make every stage mean one thing. |
Use the Same Denominator When You Compare Performance
A discovery-call close rate should use held calls in the denominator if that is the behavior you are evaluating. A proposal win rate should use proposals or recommendations. An overall lead-to-client rate should begin with all leads created under the same definition.
This sounds basic, but it prevents several common reporting mistakes:
Comparing a salesperson’s qualified-opportunity win rate with another person’s raw-lead conversion rate.
Calling no-shows “lost sales” when the sales conversation never happened.
Counting old leads that closed this month against only the new leads created this month.
Combining renewals with new-business opportunities even though the buying conditions are completely different.
Changing qualification criteria halfway through the quarter without noting the change.
Salesforce’s sales-reporting guidance makes the same contextual point: conversion reports become more useful when segmented by stage and deal type because different kinds of opportunities do not convert the same way.
Track Calendar Activity and Cohort Conversion Separately
This is one of the easiest places for a service business to accidentally lie to itself with perfectly correct arithmetic.
Imagine you generated 30 leads in August and closed six clients in August. Dividing six by 30 gives you 20 percent. But what if four of those clients first entered the pipeline in June and July? You just mixed one month’s sales with another month’s leads.
That may be fine for an activity report. It is not a clean cohort conversion rate.

Calendar reporting and cohort reporting answer different sales questions.
Use two views:
Calendar view for operating activity: calls held, recommendations made, clients closed, revenue collected, open decisions, and follow-ups due during the reporting period.
Cohort view for conversion quality: follow the leads, qualified prospects, or recommendations created in one period until enough time has passed for the normal sales cycle to mature.
If your average sales cycle is 45 days, the August cohort should not be judged on September 1 as if every qualified opportunity had time to decide. Keep an open-cohort status or wait until the agreed maturity window before using the rate as final performance evidence.
Work Through a Service-Business Example
Assume a consultant reviews one mature cohort and sees the following movement:

If the owner reports only “I closed five out of 15 calls, so my close rate was 33.3 percent,” the number is not wrong. It is simply incomplete.
The stack shows something more useful. Lead quality is 60 percent. Qualified prospects book at 75 percent. Show rate is 83.3 percent. The consultant appropriately recommends the offer to 80 percent of held calls. The recommendation-to-client win rate is 41.7 percent.
That tells me not to immediately rewrite the sales script. I would first compare the booking and show rates with prior cohorts, then look at why seven recommended prospects did not close. If several are still in a valid decision window, the 41.7 percent rate may not even be final yet.
This is what measurement should do. It narrows the investigation.
Related reading: How to Diagnose the Real Sales Problem
Track Immediate Wins and Follow-Up Wins Separately
A service sale does not have to close on the discovery call to count as an effective sales process.
Suppose three of the five clients in the example enrolled during the call and two enrolled after structured follow-up. Your immediate win rate on 12 recommendations is 25 percent. Your mature final win rate is 41.7 percent.
That difference is useful. It tells you follow-up is recovering legitimate opportunities instead of simply “chasing people.” It also protects you from judging every undecided prospect as a sales failure the moment the Zoom call ends.
Track at least three decision outcomes after a recommendation: won immediately, won during follow-up, and closed-lost. Keep paused or nurture separate when the opportunity is still legitimate but the timing has changed.
Related reading: How to Follow Up After a Discovery Call Without Feeling Like You Are Chasing
Segment the Rate Before You Make a Big Decision
An overall conversion rate is a starting point. Segmentation tells you whether the pattern belongs to the entire business or one part of it.
Compare conversion by:
Lead source or referral partner
Offer or service line
New business versus renewal or expansion
Qualification level
Buyer type or industry when the sales process materially differs
Salesperson or closer if more than one person handles calls
Campaign or event when you are evaluating a specific acquisition effort
This is where lead-source tracking becomes important. A source that produces fewer leads can still be more valuable when the qualified rate, close rate, contract value, or decision speed is stronger.
Related reading: How to Track Lead Sources and Client Acquisition Results
Always Show the Count Beside the Percentage
Small numbers can make a rate look dramatic long before you have enough evidence to call it a pattern.
One referral. One sale. That is technically a 100 percent conversion rate. It is not yet a predictable channel.
Two wins from four recommendations is 50 percent. Ten wins from 20 recommendations is also 50 percent. The percentages match, but the second result gives you more evidence.
Small-sample rule Never review a conversion percentage without the numerator and denominator beside it. Use the percentage to see direction, and use the count to judge how much confidence the pattern deserves. |
For a founder-led business with lower deal volume, look at rolling 60- or 90-day views, quarterly cohorts, or enough completed opportunities to make the pattern meaningful. Do not force a weekly “benchmark” when you only hold two sales calls a month.
Track Decision Time and Loss Reasons Beside Conversion
Conversion rate tells you how many moved. It does not tell you why they moved or how long the movement took.
Add two fields to the report:
Decision time: number of days from the stage you care about, such as qualification or recommendation, to won or lost.
Closed-lost reason: the primary documented reason an opportunity did not move forward, such as no fit, timing, budget limitation, decision authority, competitor, no response, or unresolved value concern.
Salesforce includes average conversion time, pipeline age, lead source, and conversion rate in its lead-analysis tools because the percentage becomes more useful when you can see how quickly movement happens and where the opportunities came from.
Do not turn loss reasons into guesswork. Record what the buyer actually told you when possible, then review patterns. “Too expensive” can mean true budget limitation, weak value clarity, poor fit, or a price higher than the buyer’s alternatives. Diagnose before you discount.
Use Conversion Rates to Plan Backward From Revenue
Once your rates are stable enough to be useful, they become planning inputs.
Say your monthly revenue goal is $30,000 and the average new contract is $5,000. You need six clients.
If your mature recommendation-to-win rate is 40 percent, you need about 15 recommended opportunities to produce six clients. If you recommend an offer to 80 percent of held calls, you need about 19 held calls. At an 83 percent show rate, that means about 23 booked calls. At a 75 percent qualified-to-booked rate, you need about 31 qualified prospects. At a 60 percent lead-to-qualified rate, you need roughly 52 leads.
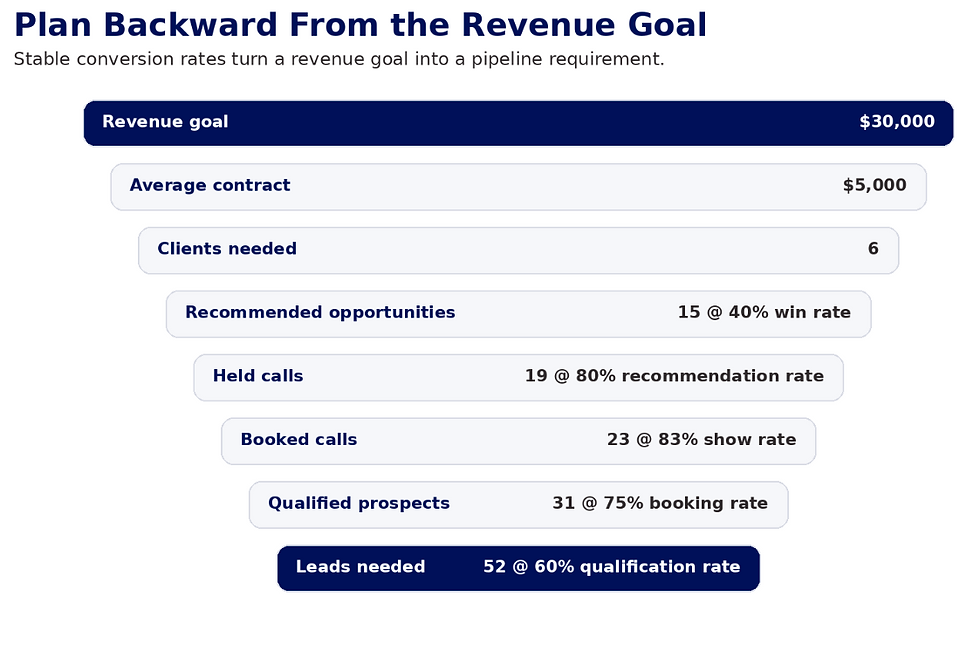
Backward sales conversion forecast from revenue goal to leads required.
Salesforce uses the same general planning logic when it calculates lead goals from the number of customers needed and the lead-to-customer close rate. The difference here is that we are preserving each service-business handoff instead of pretending one overall percentage explains the entire path.
Planning caution Do not forecast with a rate that has only a handful of observations or a rate from a completely different offer. Use your own mature data, show the sample size, and update the plan when the evidence changes. |
Build a Dashboard That Forces a Decision
A dashboard should not become another place where numbers go to sit.
For a small service business, your weekly or monthly sales view can be simple:

A useful sales conversion dashboard includes counts, rates, trend, and one decision.
Minimum dashboard fields:
Stage count
Stage-to-stage conversion rate
Prior-period or rolling trend
Average decision time
Top closed-lost reasons
Lead source and offer filters
Open opportunities by age
One decision or experiment to test next
Review leading activity weekly if you have enough volume. Review mature conversion patterns monthly.
Make larger process decisions on a cadence that respects your sales cycle and sample size.
If a number changes, ask what changed in the process before you build an entire strategy around it. New lead source? Different offer? Price increase? New qualification form? One unusually large partner campaign? Seasonality? The context belongs beside the metric.
Do Not Chase a Universal “Good” Conversion Rate
I understand why people search for a benchmark. A number feels safer when someone else tells you what it should be.
The problem is that conversion rates change with the denominator, offer price, sales cycle, lead source, qualification standard, buyer urgency, and business model. HubSpot explicitly notes that lead conversion varies across stages and industries, which is why no single average works for every business.
Salesforce also recommends analyzing conversion in context by lead type and pipeline stage.
Your useful benchmark is your own well-defined historical rate, segmented by the conditions that materially affect the sale.
If your recommendation-to-win rate moves from 30 percent to 42 percent after you tighten qualification and follow-up, that is evidence. If a referral source repeatedly closes faster and at a higher contract value than cold social leads, that is evidence. If your overall conversion falls because you intentionally widened top-of-funnel reach while qualified-opportunity win rate stays healthy, that is a different story from a collapsing sales process.
Benchmarks can provide context. They should not overrule the facts inside your own pipeline.
Complete a 30-Minute Sales Conversion Review

Do not change five stages at once. If you change qualification, reminders, call structure, pricing, and follow-up in the same week, you will not know which change produced the movement. Find the earliest meaningful breakdown, test one correction, and keep tracking.
Frequently Asked Questions About Sales Conversion Rate
How do I calculate sales conversion rate?
Divide the number of completed conversions by the number that entered the defined starting stage, then multiply by 100. Always name the start and end stage. Five clients from 20 qualified opportunities is a 25 percent qualified-opportunity win rate.
What is a good sales conversion rate?
There is no single rate that fits every service business. Use your own rate by lead source, offer, qualification level, and sales stage as the primary benchmark, then track movement over time.
Is close rate the same as sales conversion rate?
Close rate is one type of sales conversion rate. It usually refers to the percentage of qualified opportunities, recommendations, proposals, or sales conversations that become clients. Sales conversion rate can also describe movement at earlier stages.
Should I divide clients by leads or by discovery calls?
It depends on the question. Clients divided by leads measures overall lead-to-client conversion. Clients divided by held discovery calls measures call-to-client conversion. Track both, but label them clearly.
How often should I track conversion rate?
Update stage counts continuously or weekly, review meaningful conversion trends monthly, and use longer cohorts when the sales cycle is longer or deal volume is low.
What if my sales cycle is longer than one month?
Use cohort reporting. Follow opportunities created or recommended in the same period until the normal decision window has matured. Keep calendar activity reports separate from cohort conversion reports.
Can a high conversion rate still be a problem?
Yes. A very high close rate with very low lead volume may still miss the revenue goal. It can also mean the business is qualifying too narrowly or only counting the easiest opportunities. Look at volume, contract value, margin, capacity, and source quality with the rate.
What should I fix first if my close rate drops?
Start with definitions and data quality, then review qualification and diagnosis before jumping to scripts or objection handling. A later-stage tactic cannot repair poor-fit opportunities entering the process.
Track the Sales Process You Want to Improve
Your sales conversion rate should not be a number you check when revenue feels slow and forget when business gets busy.
Define the stages. Keep the counts. Calculate the handoffs. Separate calendar activity from mature cohorts. Track decision time and loss reasons. Segment the rate before making a big decision. Then use the data to choose one correction.
That is how the sales process stops being a personality trait and starts becoming a system.
Score your sales process before you change it Use the Sales Conversion Scorecard to review qualification, discovery, diagnosis, recommendation, pricing, objections, the close, follow-up, and measurement. Identify the weakest stage and choose the first correction to test. |
If you want guided support connecting your offer, message, customer journey, follow-up, and KPI tracking, Compass Mentoring is built to help service-based entrepreneurs create a sales process they can run and improve consistently.
About the Author
LaShay LaRue is the founder of Cherished Investments and a business coach, marketing strategist, and systems architect for service-based entrepreneurs. With more than a decade in business development, she helps coaches, consultants, creatives, and clinicians turn expertise into clear offers, sales funnels, and operating systems that support consistent growth. Her work is rooted in faith, service, strategy, and the belief that a well-built business creates room for greater generosity and impact.



Comments